Features / Stock Analysis
RSI, MACD, ATR, and the options market's own put/call ratio and max pain, plotted together — then a fully configurable AI analysis, on the model of your choice, ending in a clear verdict and exact trade setups.
Price technicals and options-derived metrics don't have to live in separate tabs. RSI, MACD, ATR, moving averages, and the options market's own put/call ratio and max pain — all against the same timeline.
Multiple moving averages, RSI(14), MACD(12,26,9), and ATR(14) — the standard toolkit, already configured, not built from scratch.
Put/call ratio (PCR) and max pain plotted over time alongside price, so you see how the options market's positioning shifts as price moves — not just today's snapshot.
Drill from a 1-second tick chart to a weekly view without losing your indicator setup.
Dividends, earnings, and your own alerts show up as markers on the timeline — context without leaving the chart.
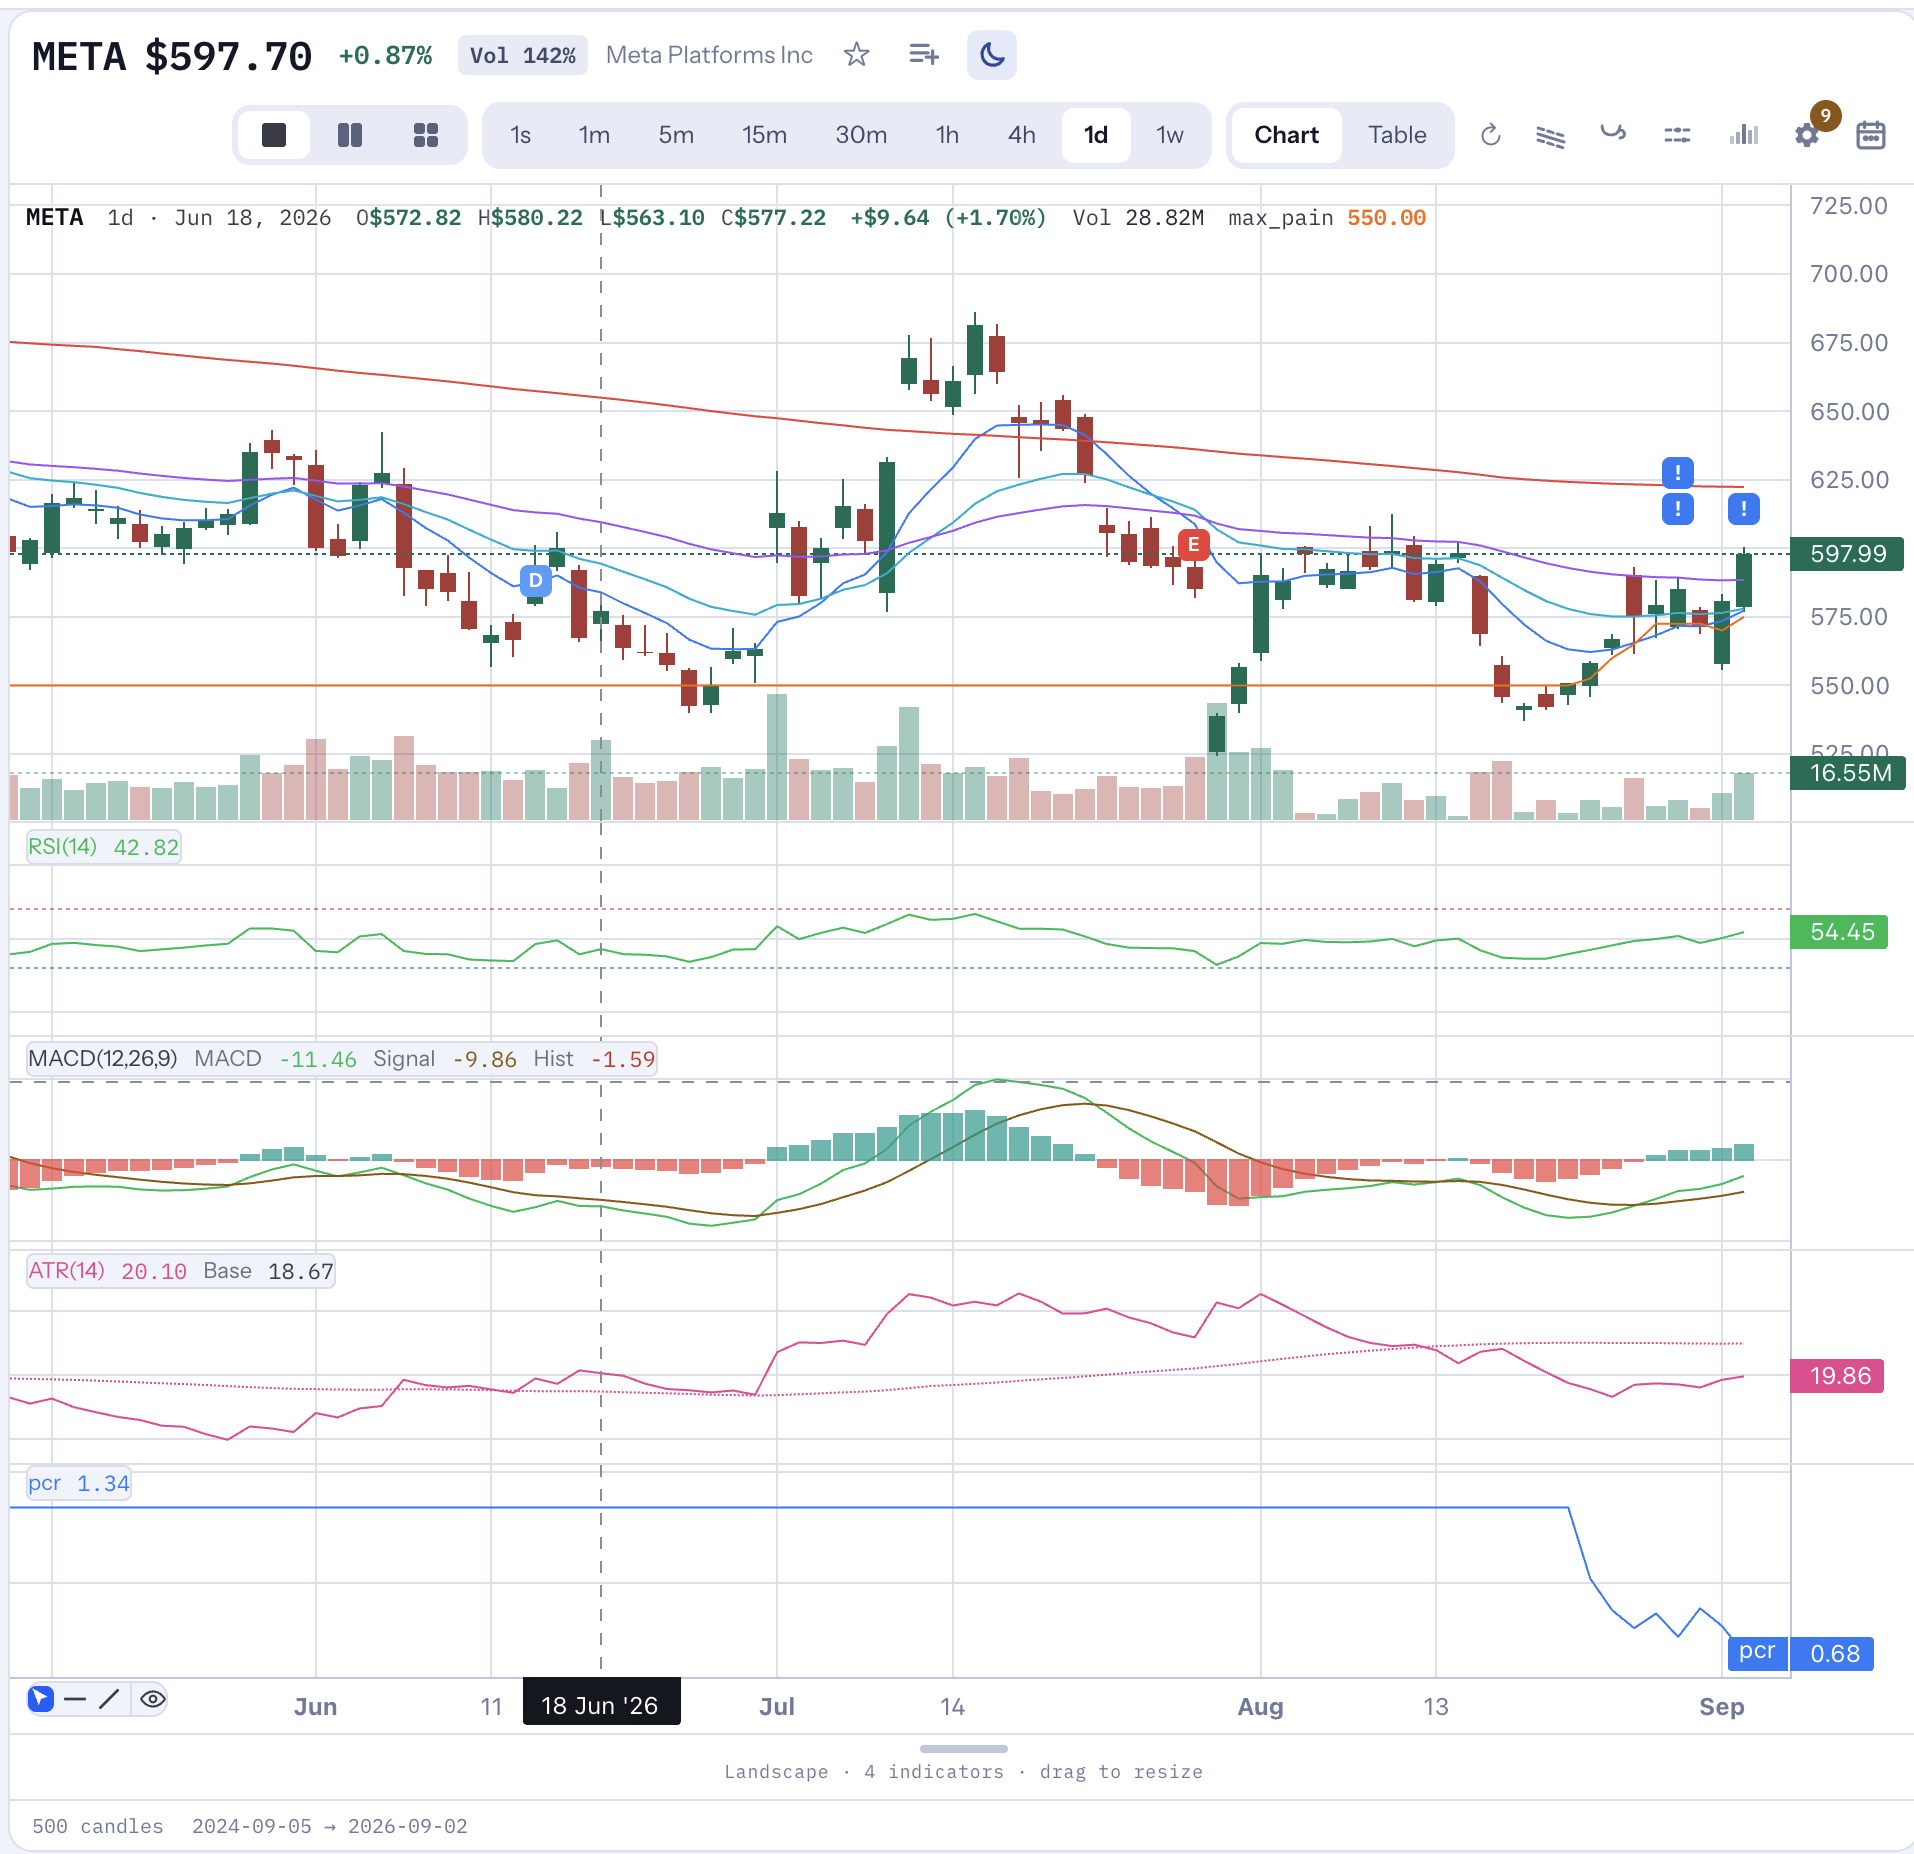
RSI, MACD, ATR, and PCR — price technicals and options positioning, read together instead of in separate tabs.
52-week range, volume against its own average, news sentiment, and analyst ratings — the background information that shapes how you read everything else on the page.
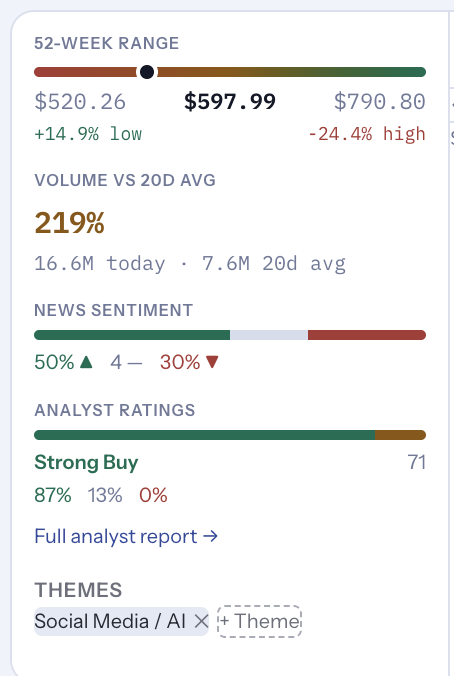
Where price sits in its own range, how loud today's volume is, and what analysts and the news are actually saying — in one glance.
Choose how much history to send, which timeframe to analyze, and exactly which topics matter to you — then run it on whichever model you trust.
Choose the period and timeframe — up to a full year of daily candles — so the analysis is grounded in real history, not a snapshot.
Fast and cheap, or best quality — choose between models like Haiku, Sonnet, or DeepSeek's Flash and Pro tiers, matched to how much you want to spend versus how deep you want the read.
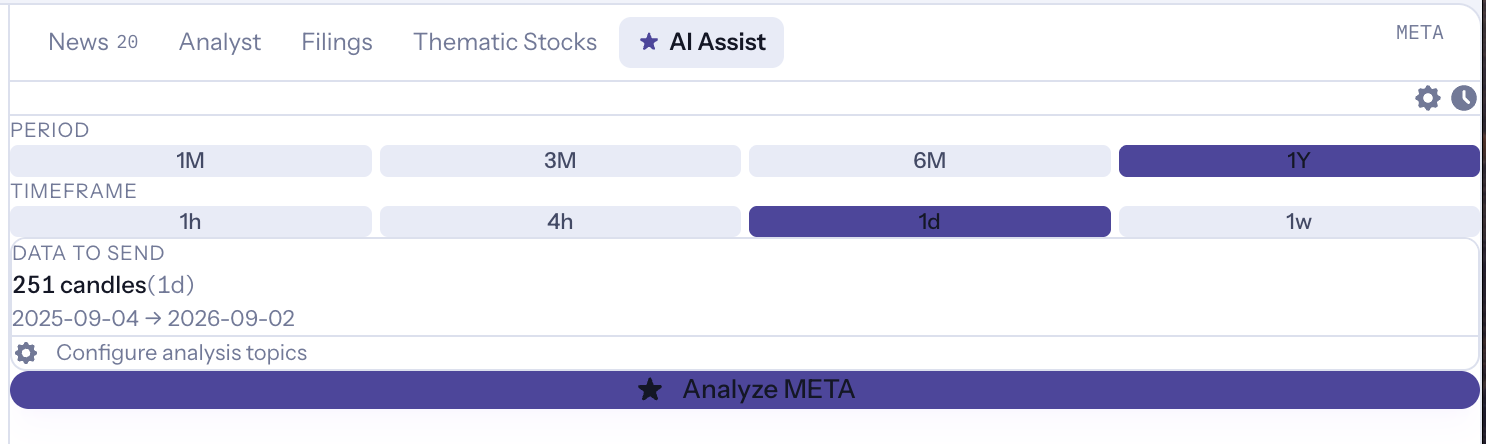
Up to 251 daily candles — a full year — before a single word of analysis gets generated.
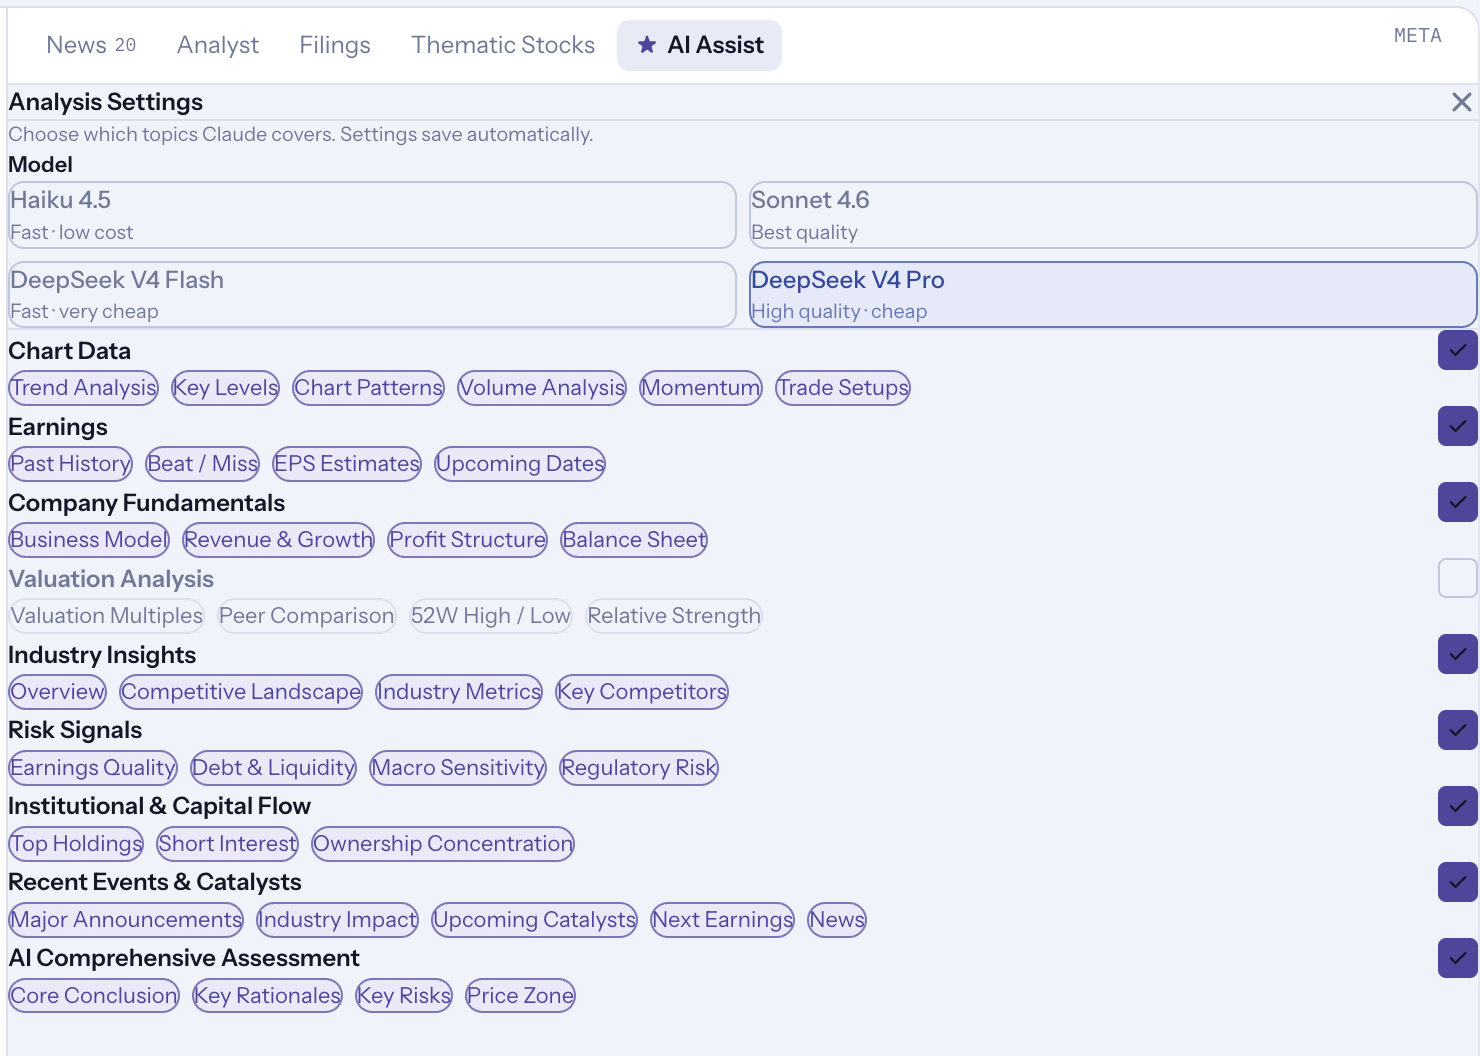
Turn categories on or off — earnings, fundamentals, valuation, institutional flow, risk signals — so the analysis covers exactly what you care about, nothing you don't.
Not just "bullish" or "bearish" — a confidence level, a base target, and a trend narrative that explains how price got here, plus a timeline of the moves that built the current picture.
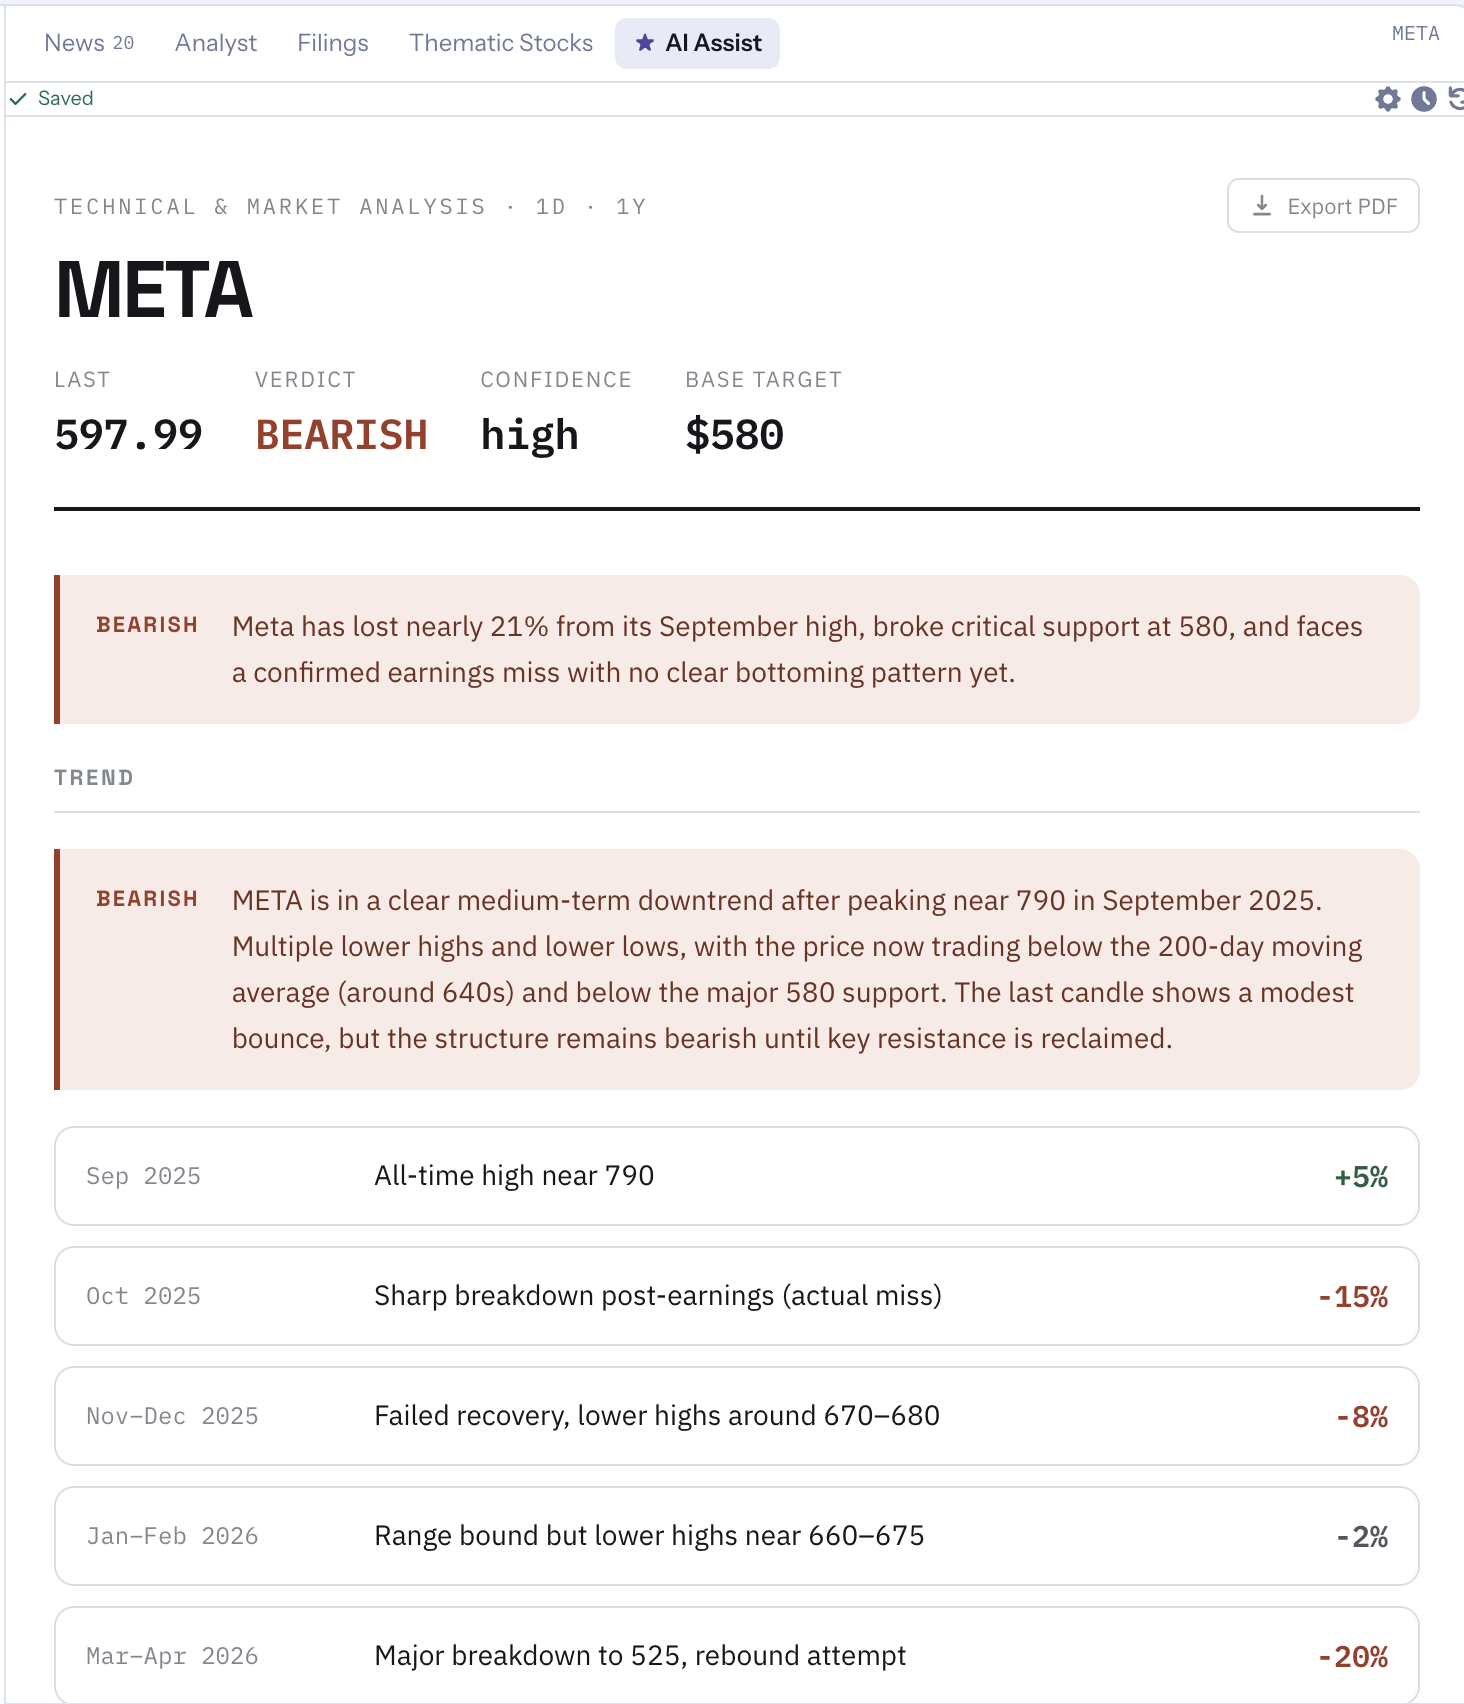
A verdict and confidence level you can act on, backed by a narrative and timeline you can actually check against the chart.
Markets don't move in only one direction — AStar lays out setups for multiple scenarios, each with its own entry condition, stop, target, and risk-to-reward.
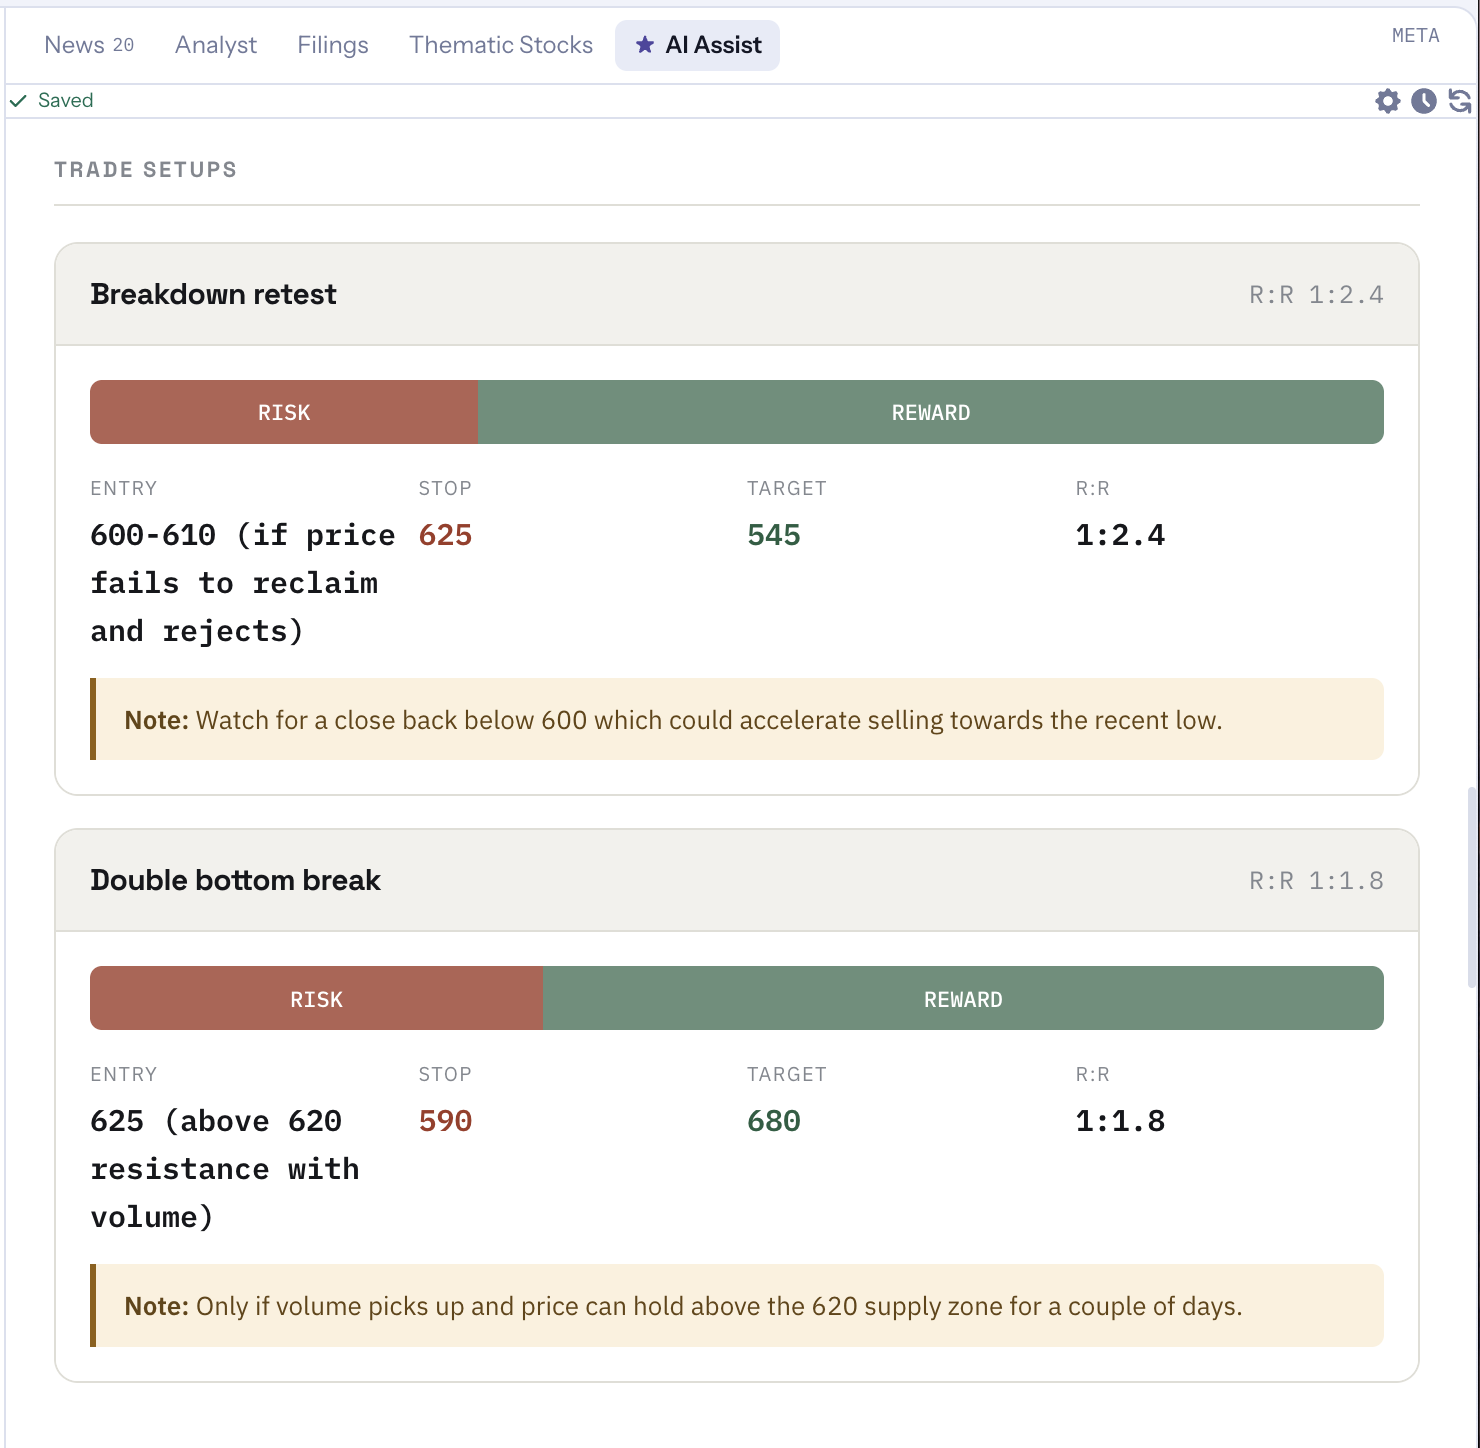
Two scenarios, two setups — each with the specific condition that would need to happen first, not just a target price floating on its own.
Every account, one balance sheet, synced automatically.
OptionsLiquidity, greeks, and IV on every strike, ranked.
OptionsBuild any strategy and see its exact payoff first.
MonitoringLive status on every position — Comfortable, Watch, Breached.
MonitoringNotified automatically when earnings or other events hit a position.
MarketSee which sectors and themes are leading, improving, weakening, or lagging.
MarketSentiment, indices, curated news, and theme momentum in one glance.
MonitoringA multi-chart wall that auto-populates from any criteria you pick.
MonitoringQuick scans for movers by percentile, price, and volume vs. the 20-day average.
AIBuild your own buy/sell criteria with AND/OR logic, and backtest before going live.
AIRules and AI surface opportunities you define.
TaxCross-broker wash-sale checks and tax-lot-aware selling.
 AStar Trading