Features / Market Overview
Sentiment, every major index, AI-ranked news, and theme momentum filtered to what's actually moving — the daily briefing, focused on what you can act on.
Fear or greed, advance/decline breadth, and the sub-metrics behind the number — the context that tells you how to read everything else on the page.
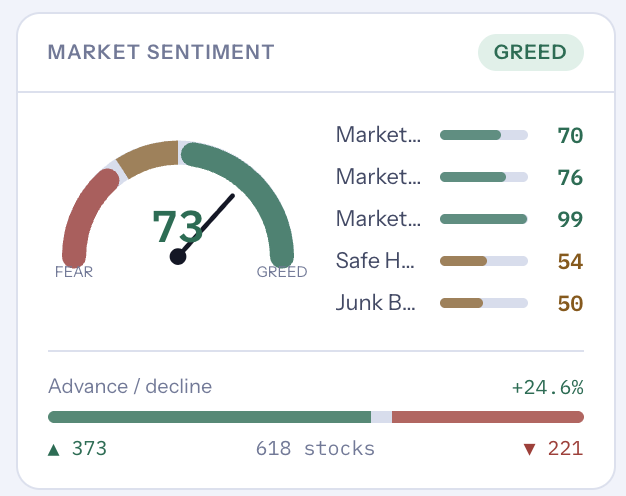
One number for the market's mood, broken down into the components that built it.
S&P 500, Nasdaq, Dow, Russell, Bitcoin, gold, bonds, VIX, and the dollar — with an intraday sparkline for each, so the shape of the move is visible, not just the number.
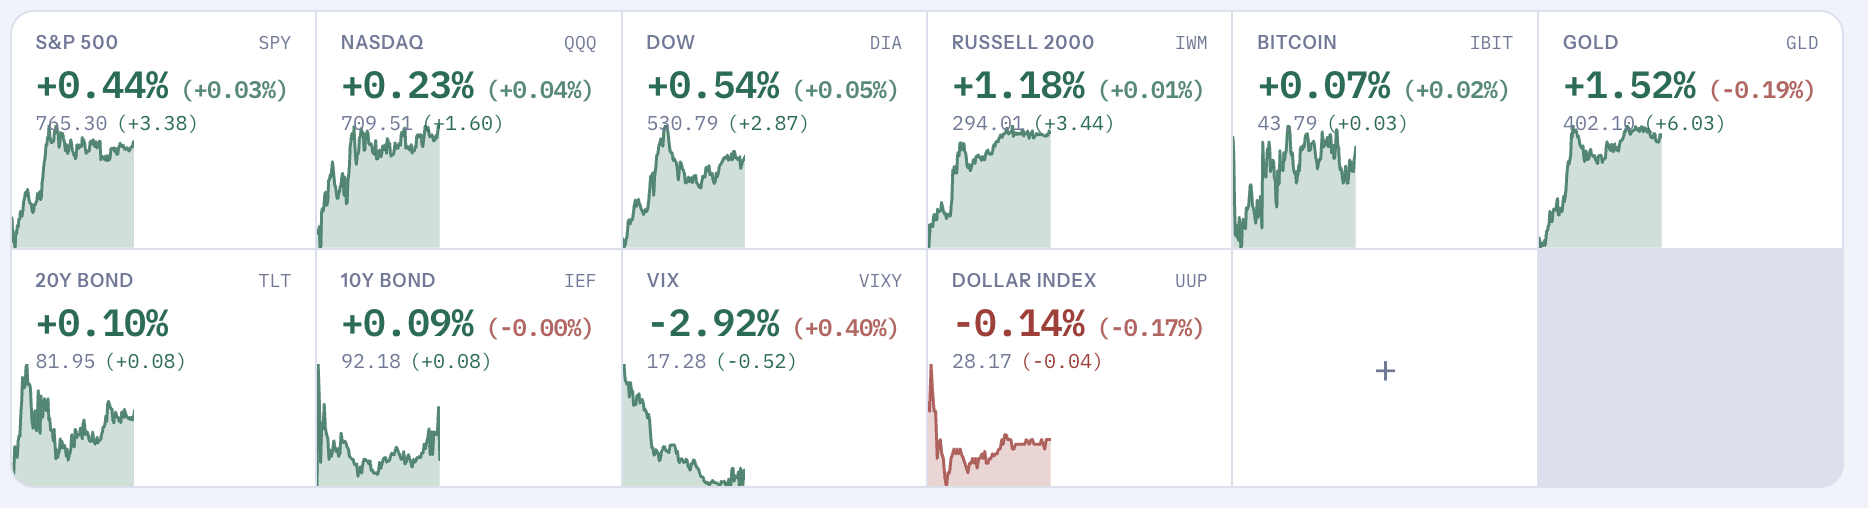
The whole market backdrop in one glance, before you look at a single position.
AI-ranked headlines tagged by category and ticker, with a one-line read on why each story matters — not a raw, unsorted news feed.
Macro data, earnings, tech/AI — every headline is categorized and linked to the specific tickers it affects.
Each story comes with a short, plain-language read on its significance, not just a headline to interpret yourself.
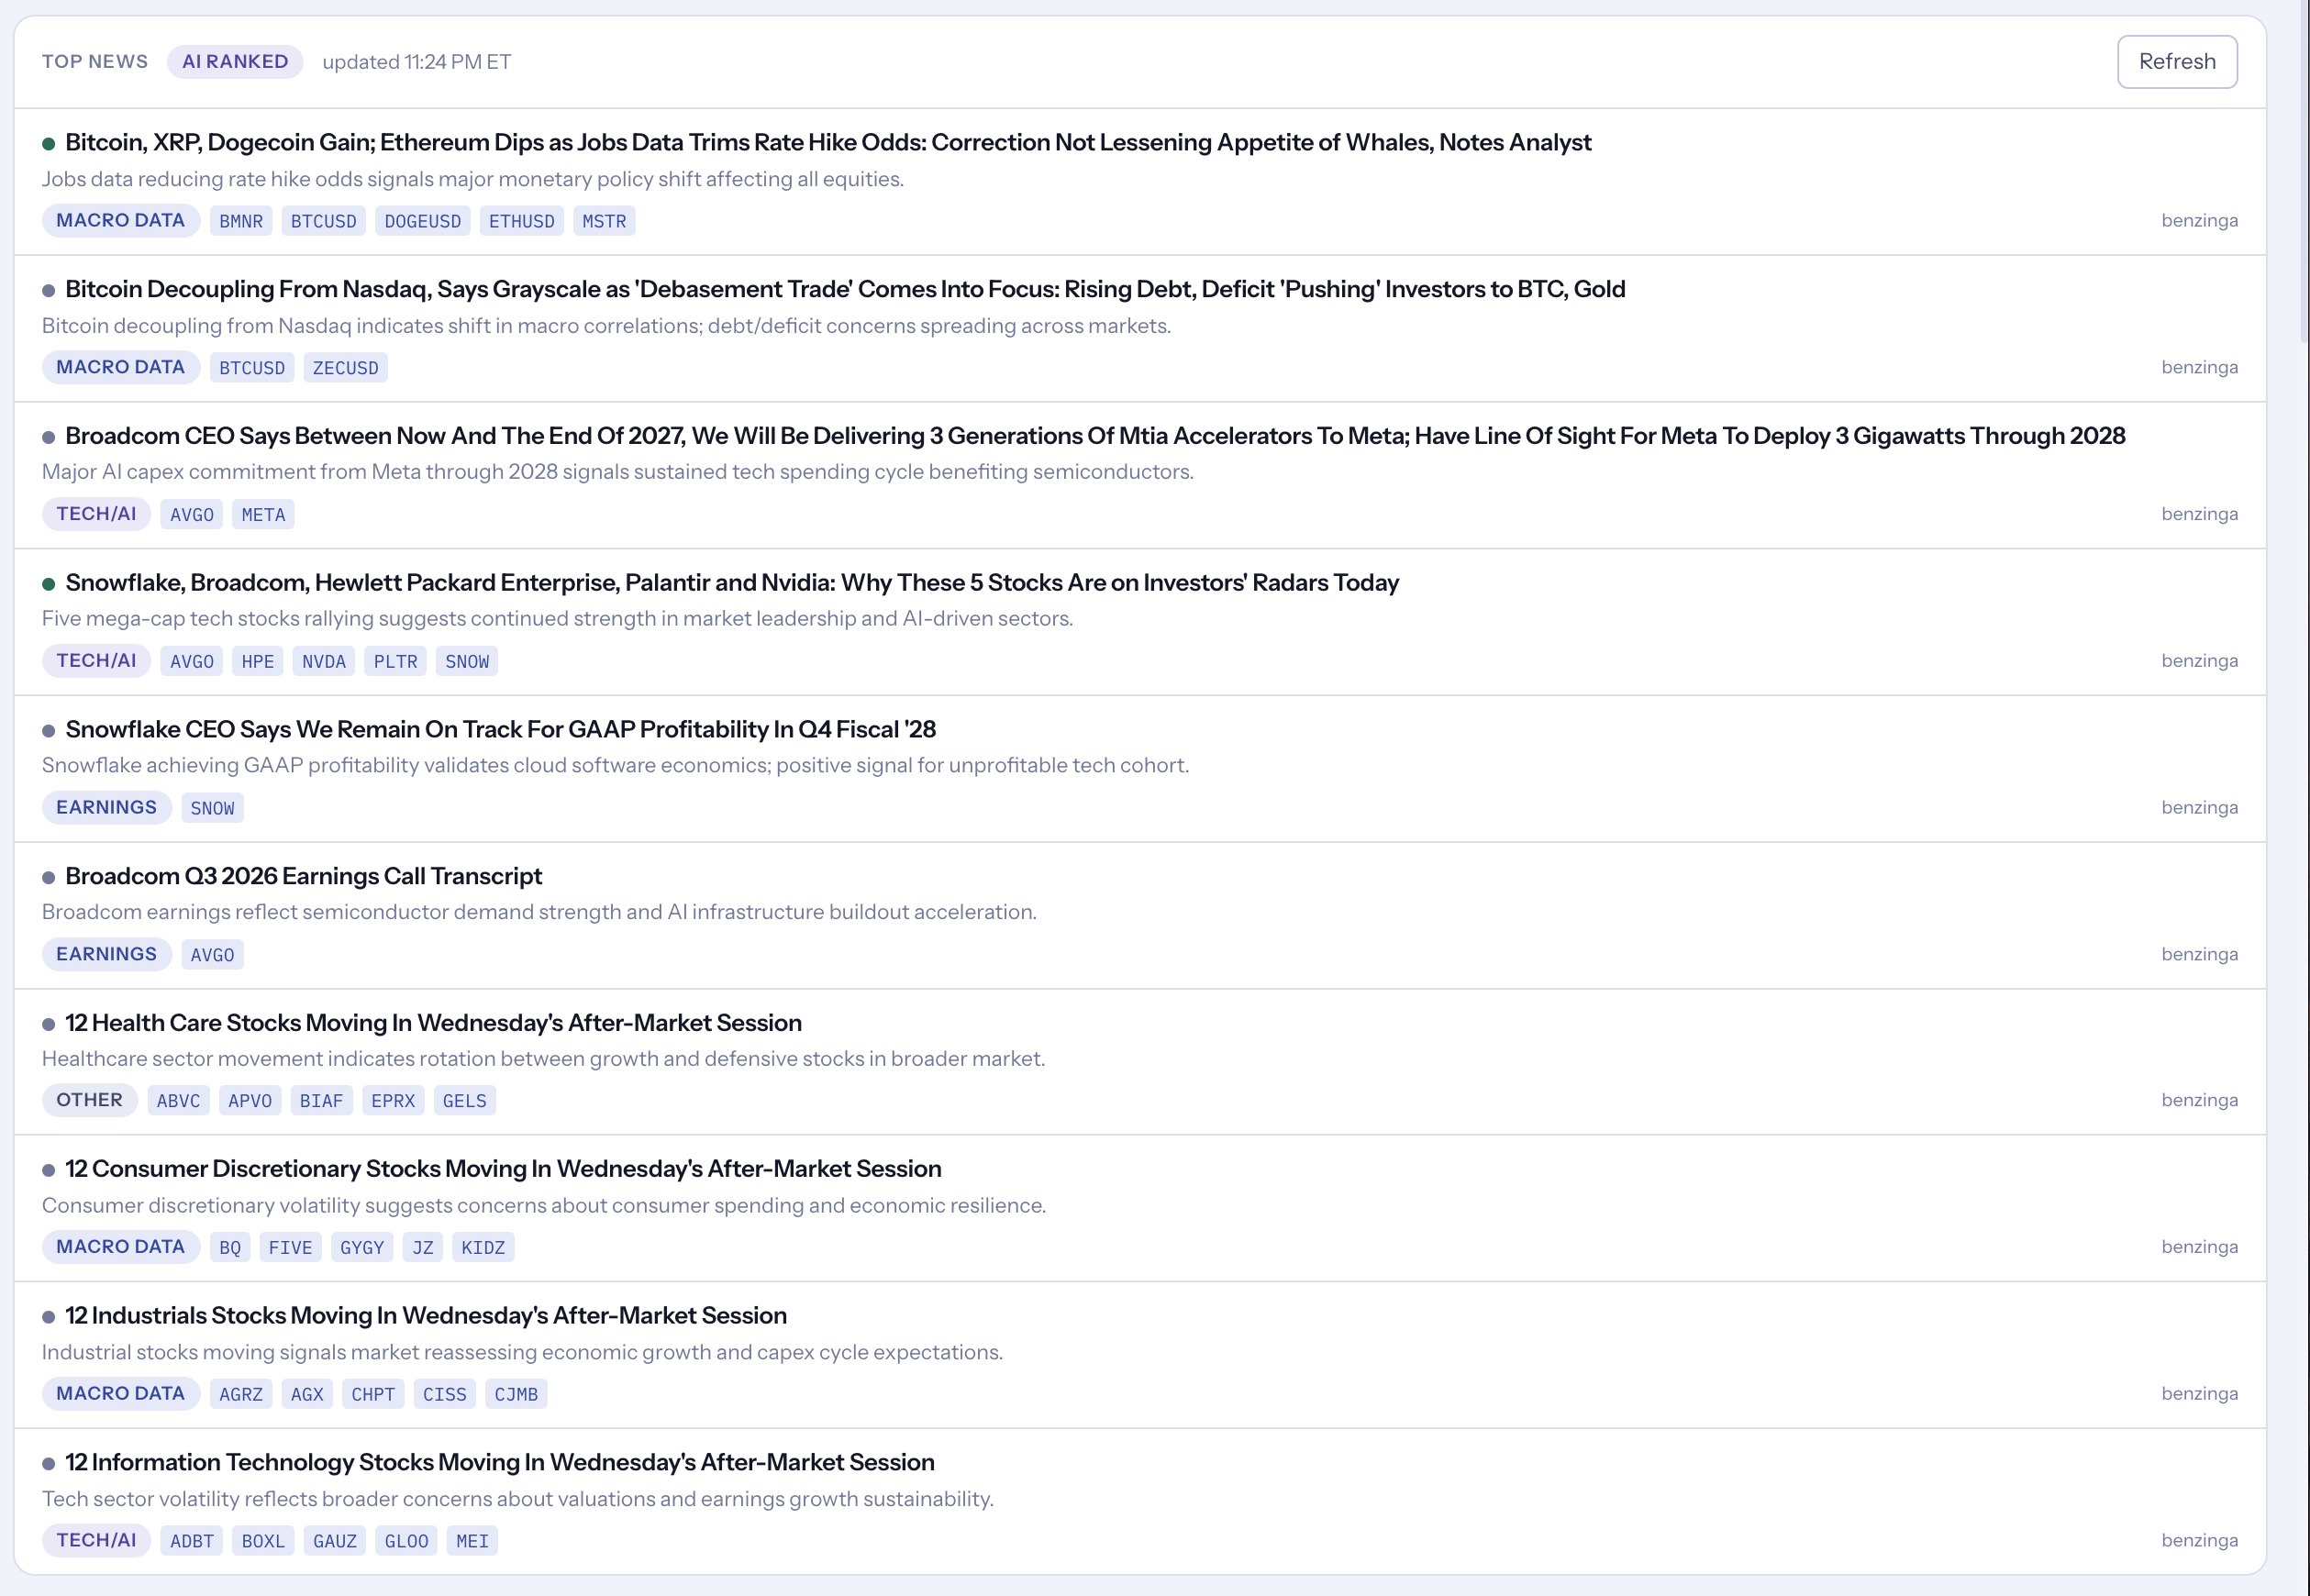
The news that's actually moving markets, ranked and tagged — not a firehose you have to sort yourself.
A percentile cutoff hides the noise — only themes with a real move surface, each shown as a distribution of its constituents, not just an average.
Set the threshold yourself — see only the top 15% of moves, or widen it out, and watch how many themes clear the bar.
Each theme shows its full spread of constituents, so a broad 17-of-19 move reads differently from one stock carrying the whole group.
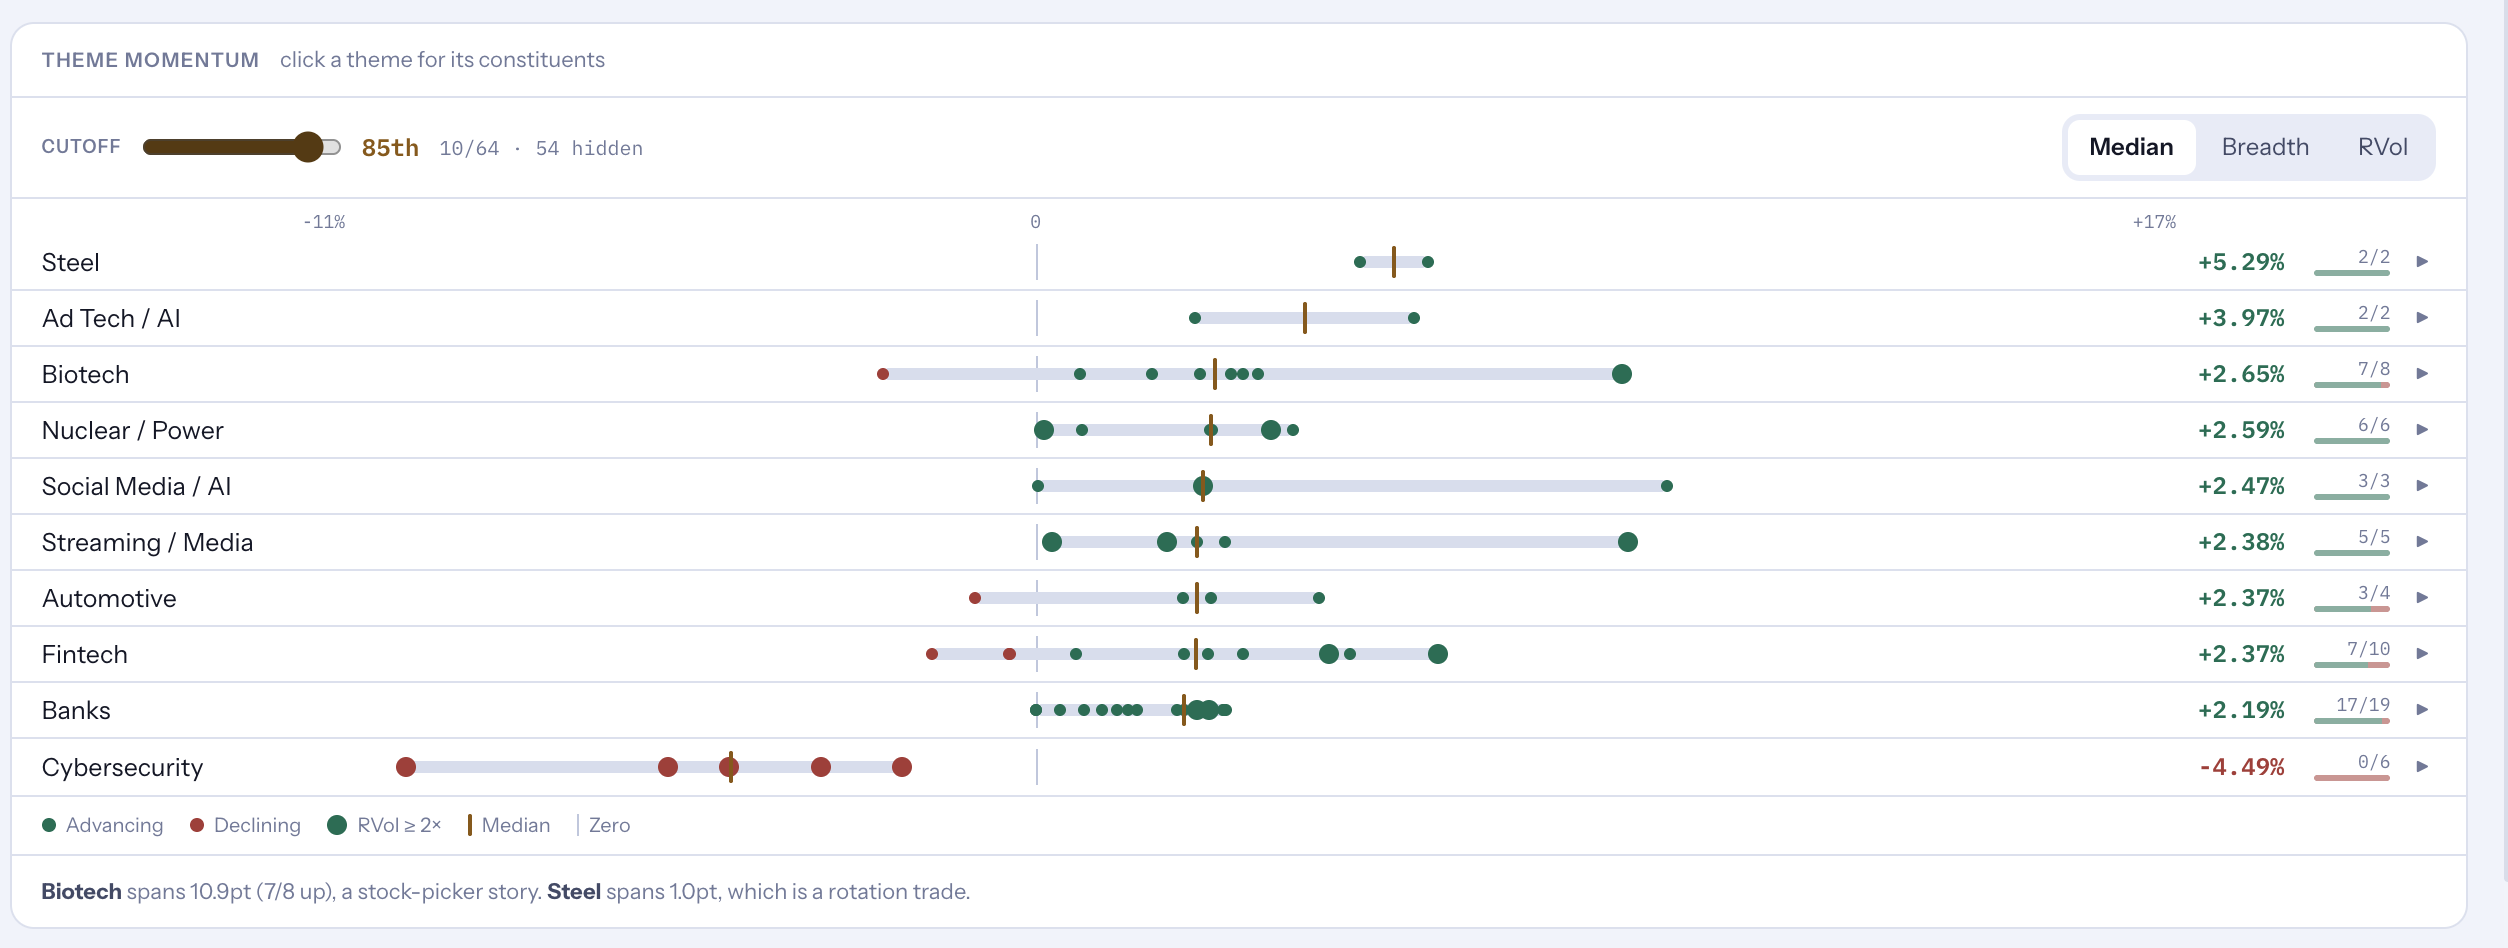
Biotech spans 10.9 points on a 7-of-8 advance — a stock-picker's move. Steel spans 1 point — a cleaner rotation trade. The shape tells you which.
Every account, one balance sheet, synced automatically.
OptionsLiquidity, greeks, and IV on every strike, ranked.
OptionsBuild any strategy and see its exact payoff first.
MonitoringLive status on every position — Comfortable, Watch, Breached.
MonitoringNotified automatically when earnings or other events hit a position.
MarketSee which sectors and themes are leading, improving, weakening, or lagging.
MonitoringA multi-chart wall that auto-populates from any criteria you pick.
MonitoringQuick scans for movers by percentile, price, and volume vs. the 20-day average.
AIEvery technical and options signal, plus a configurable AI verdict and exact trade setups.
AIBuild your own buy/sell criteria with AND/OR logic, and backtest before going live.
AIRules and AI surface opportunities you define.
TaxCross-broker wash-sale checks and tax-lot-aware selling.
 AStar Trading