Features / Stock Screener
Build a rule out of the conditions you already look for — volume against its 20-day average, an RSI level, a moving-average cross, a cup and handle — then backtest it against real historical candles before you ever turn it on.
Most screeners give you a flat list of filters joined by AND. A real setup is rarely that shape — so rules here are a tree: match ALL, ANY, or exactly ONE, with sub-groups inside.
Pick how the conditions combine, and nest a sub-group inside any slot — volume > 200% AND (RSI < 40 OR news bearish > 60%) is one rule, not three.
Price and volume, RSI, MACD crossovers and histogram turns, moving-average crosses, VWAP, ATR-relative moves, candle patterns, analyst ratings, news sentiment, market cap and dollar-volume liquidity filters.
Mark a rule as a buy or sell signal and choose how often it evaluates — every 15 minutes through to daily.
Cup and handle in the CANSLIM sense, bullish and bearish engulfing, hammer, shooting star — matched on real candles, with an optional breakout confirmation.
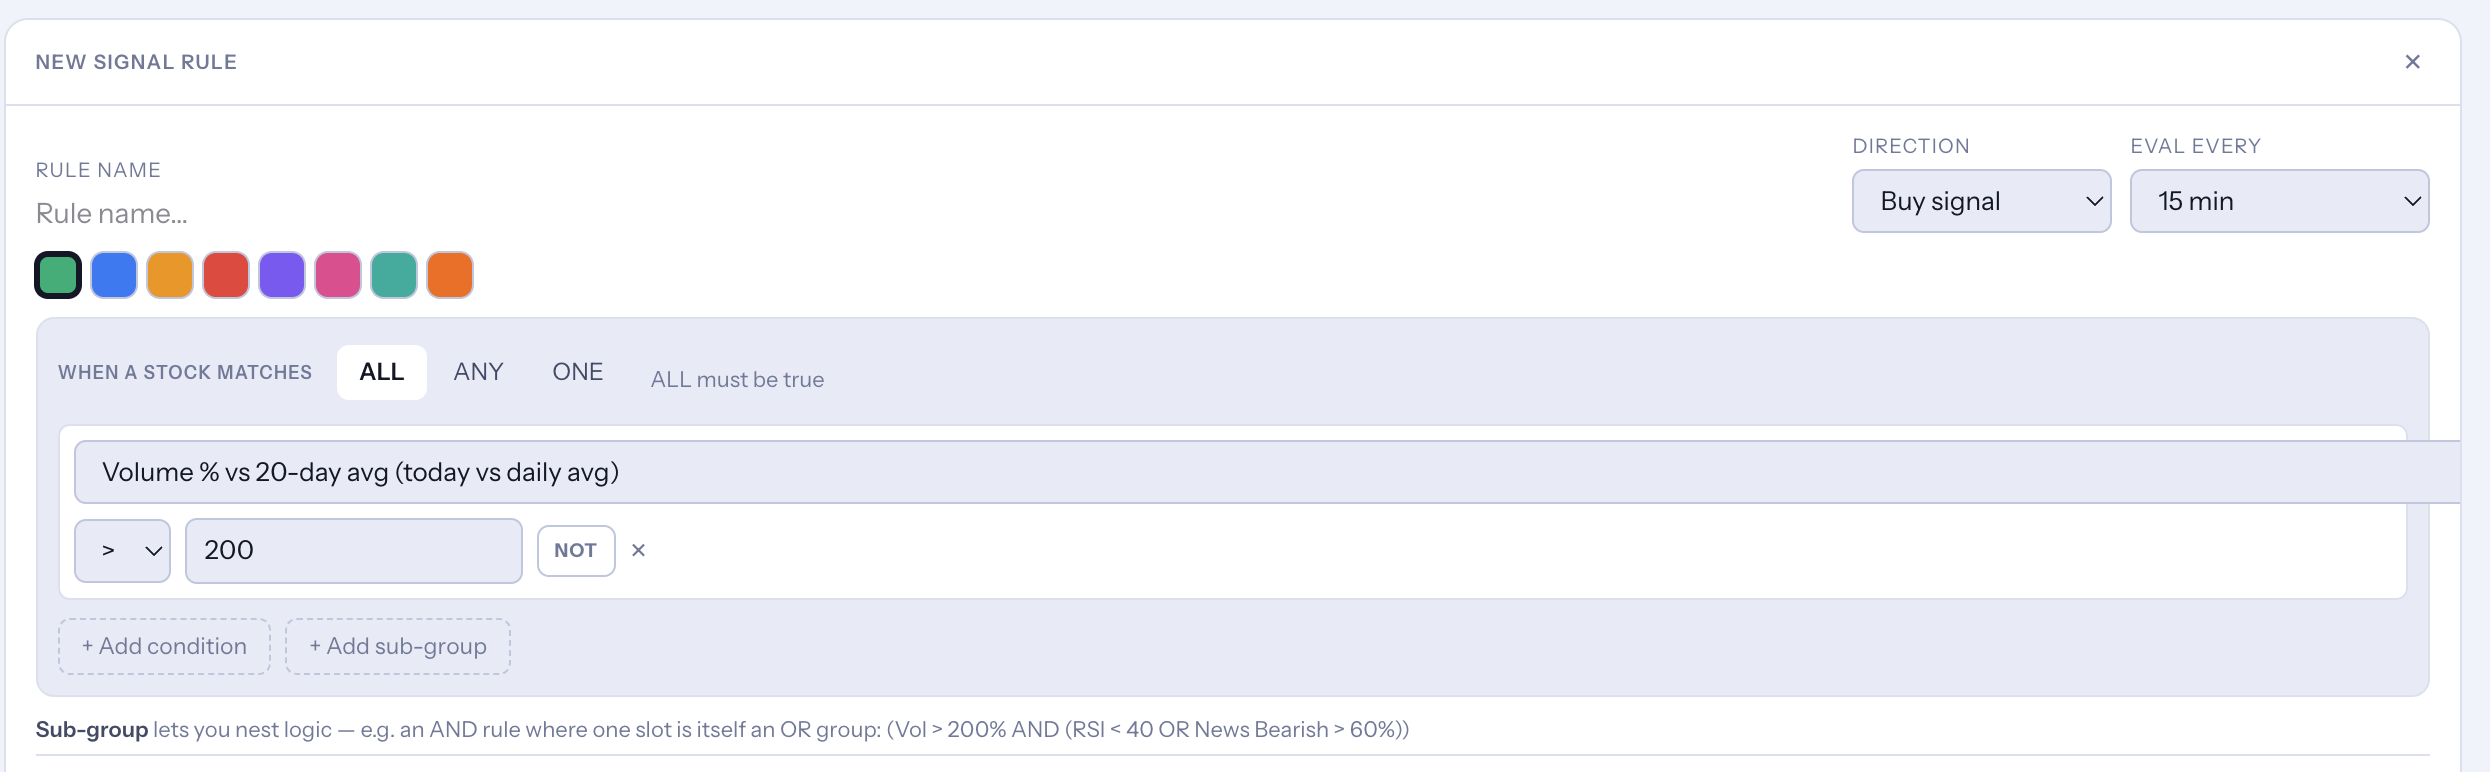
One condition or a nested tree — the rule editor is the same either way.
Replay the rule against one symbol’s real historical candles and get the exact dates it would have signalled — so you find out a rule is too loose before it starts filling your alerts.
The backtest replays the same condition tree the live evaluator uses, day by day, against stored price history.
A signal fires when a condition goes from not-matching to matching — not once per candle it happens to stay true, so a slow trend doesn’t generate fifty alerts.
Each result shows the date, the price, and the metric value that triggered it — enough to judge whether the rule caught something real.
Signals are plotted against the candles, so you can see the setup rather than read a list of timestamps.
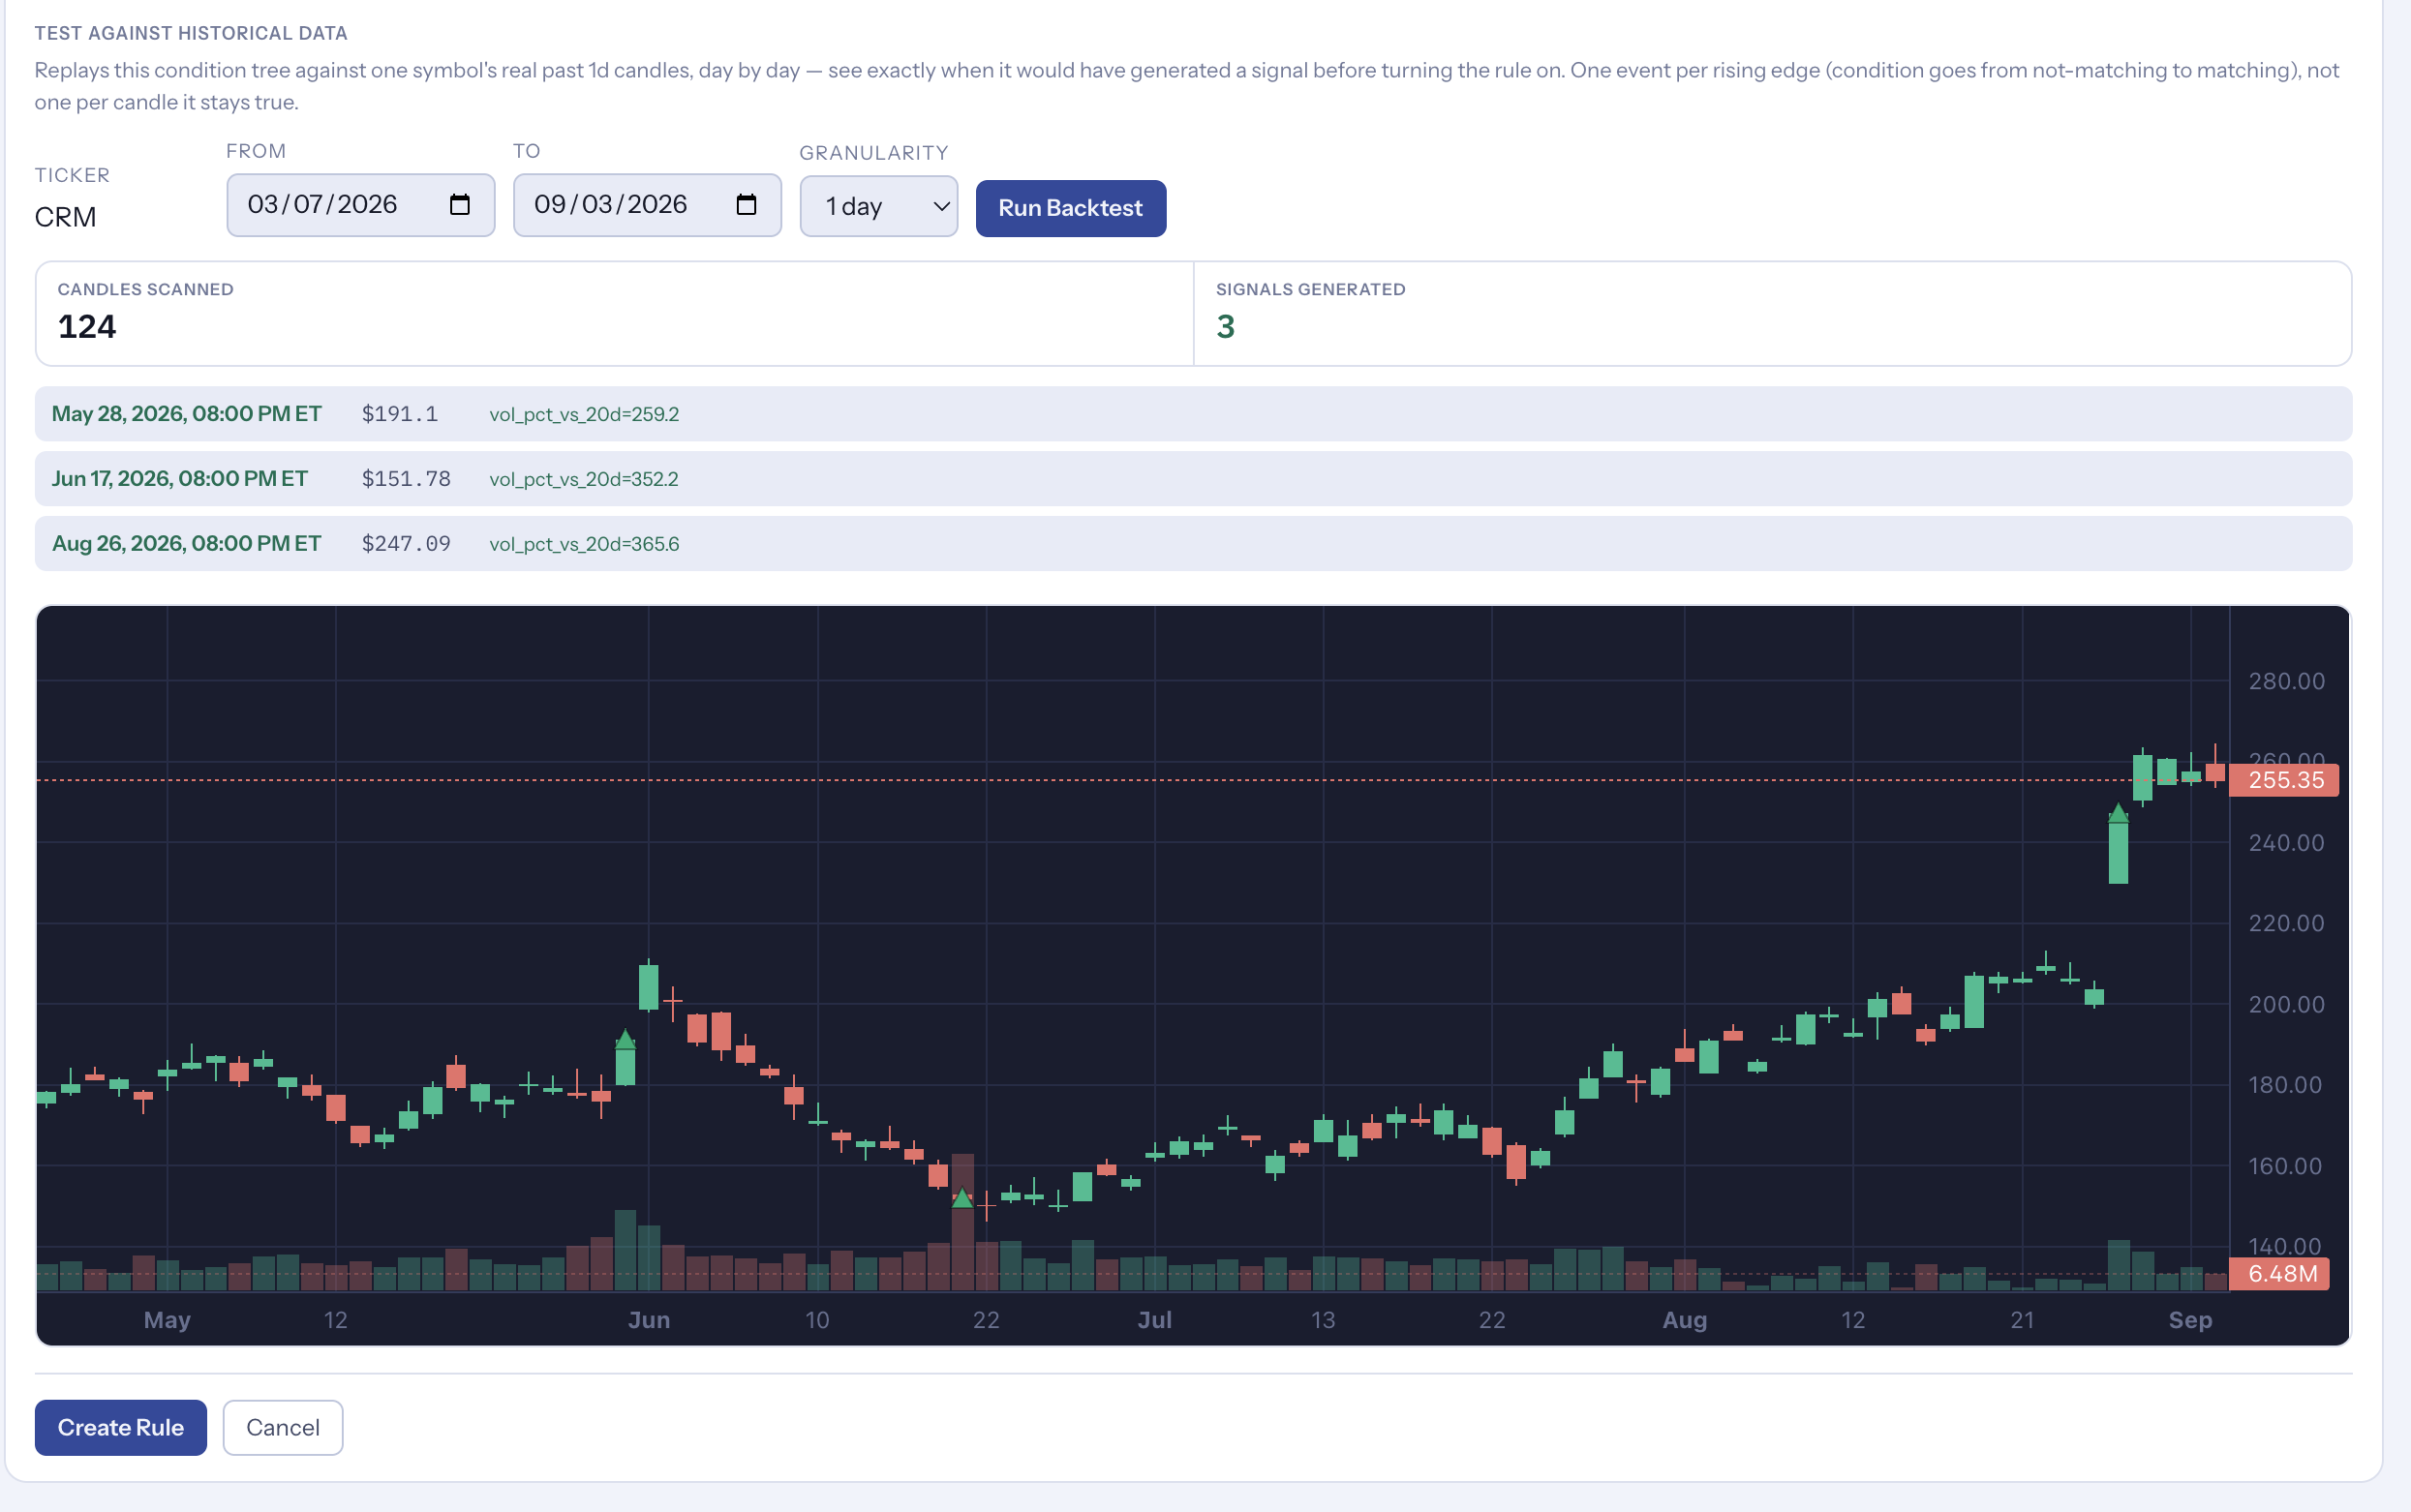
124 candles scanned, three signals — each with the date, price and the value that triggered it.
Once a rule is on, it evaluates across the universe on its own schedule and tells you how much of the market it is actually matching.
Every rule shows how many symbols it currently matches out of the universe scanned — a rule hitting 21 of 635 is doing something; one hitting 400 is not.
Toggle a rule without deleting it, edit it in place, or force an immediate evaluation when you want to see where it stands right now.

Seven rules running — each showing what it currently matches, so a rule that has stopped being selective is obvious.
 AStar Trading